
Here are some of my GIS projects in both human and environmental Mapping.
I have taken both Human GIS and Environmental GIS courses at Middlebury. In Human GIS, I mainly use QGIS. In Environmental GIS, I mainly use Google Earth Engine. For more technical projects in my work experience, I use ArcGIS.
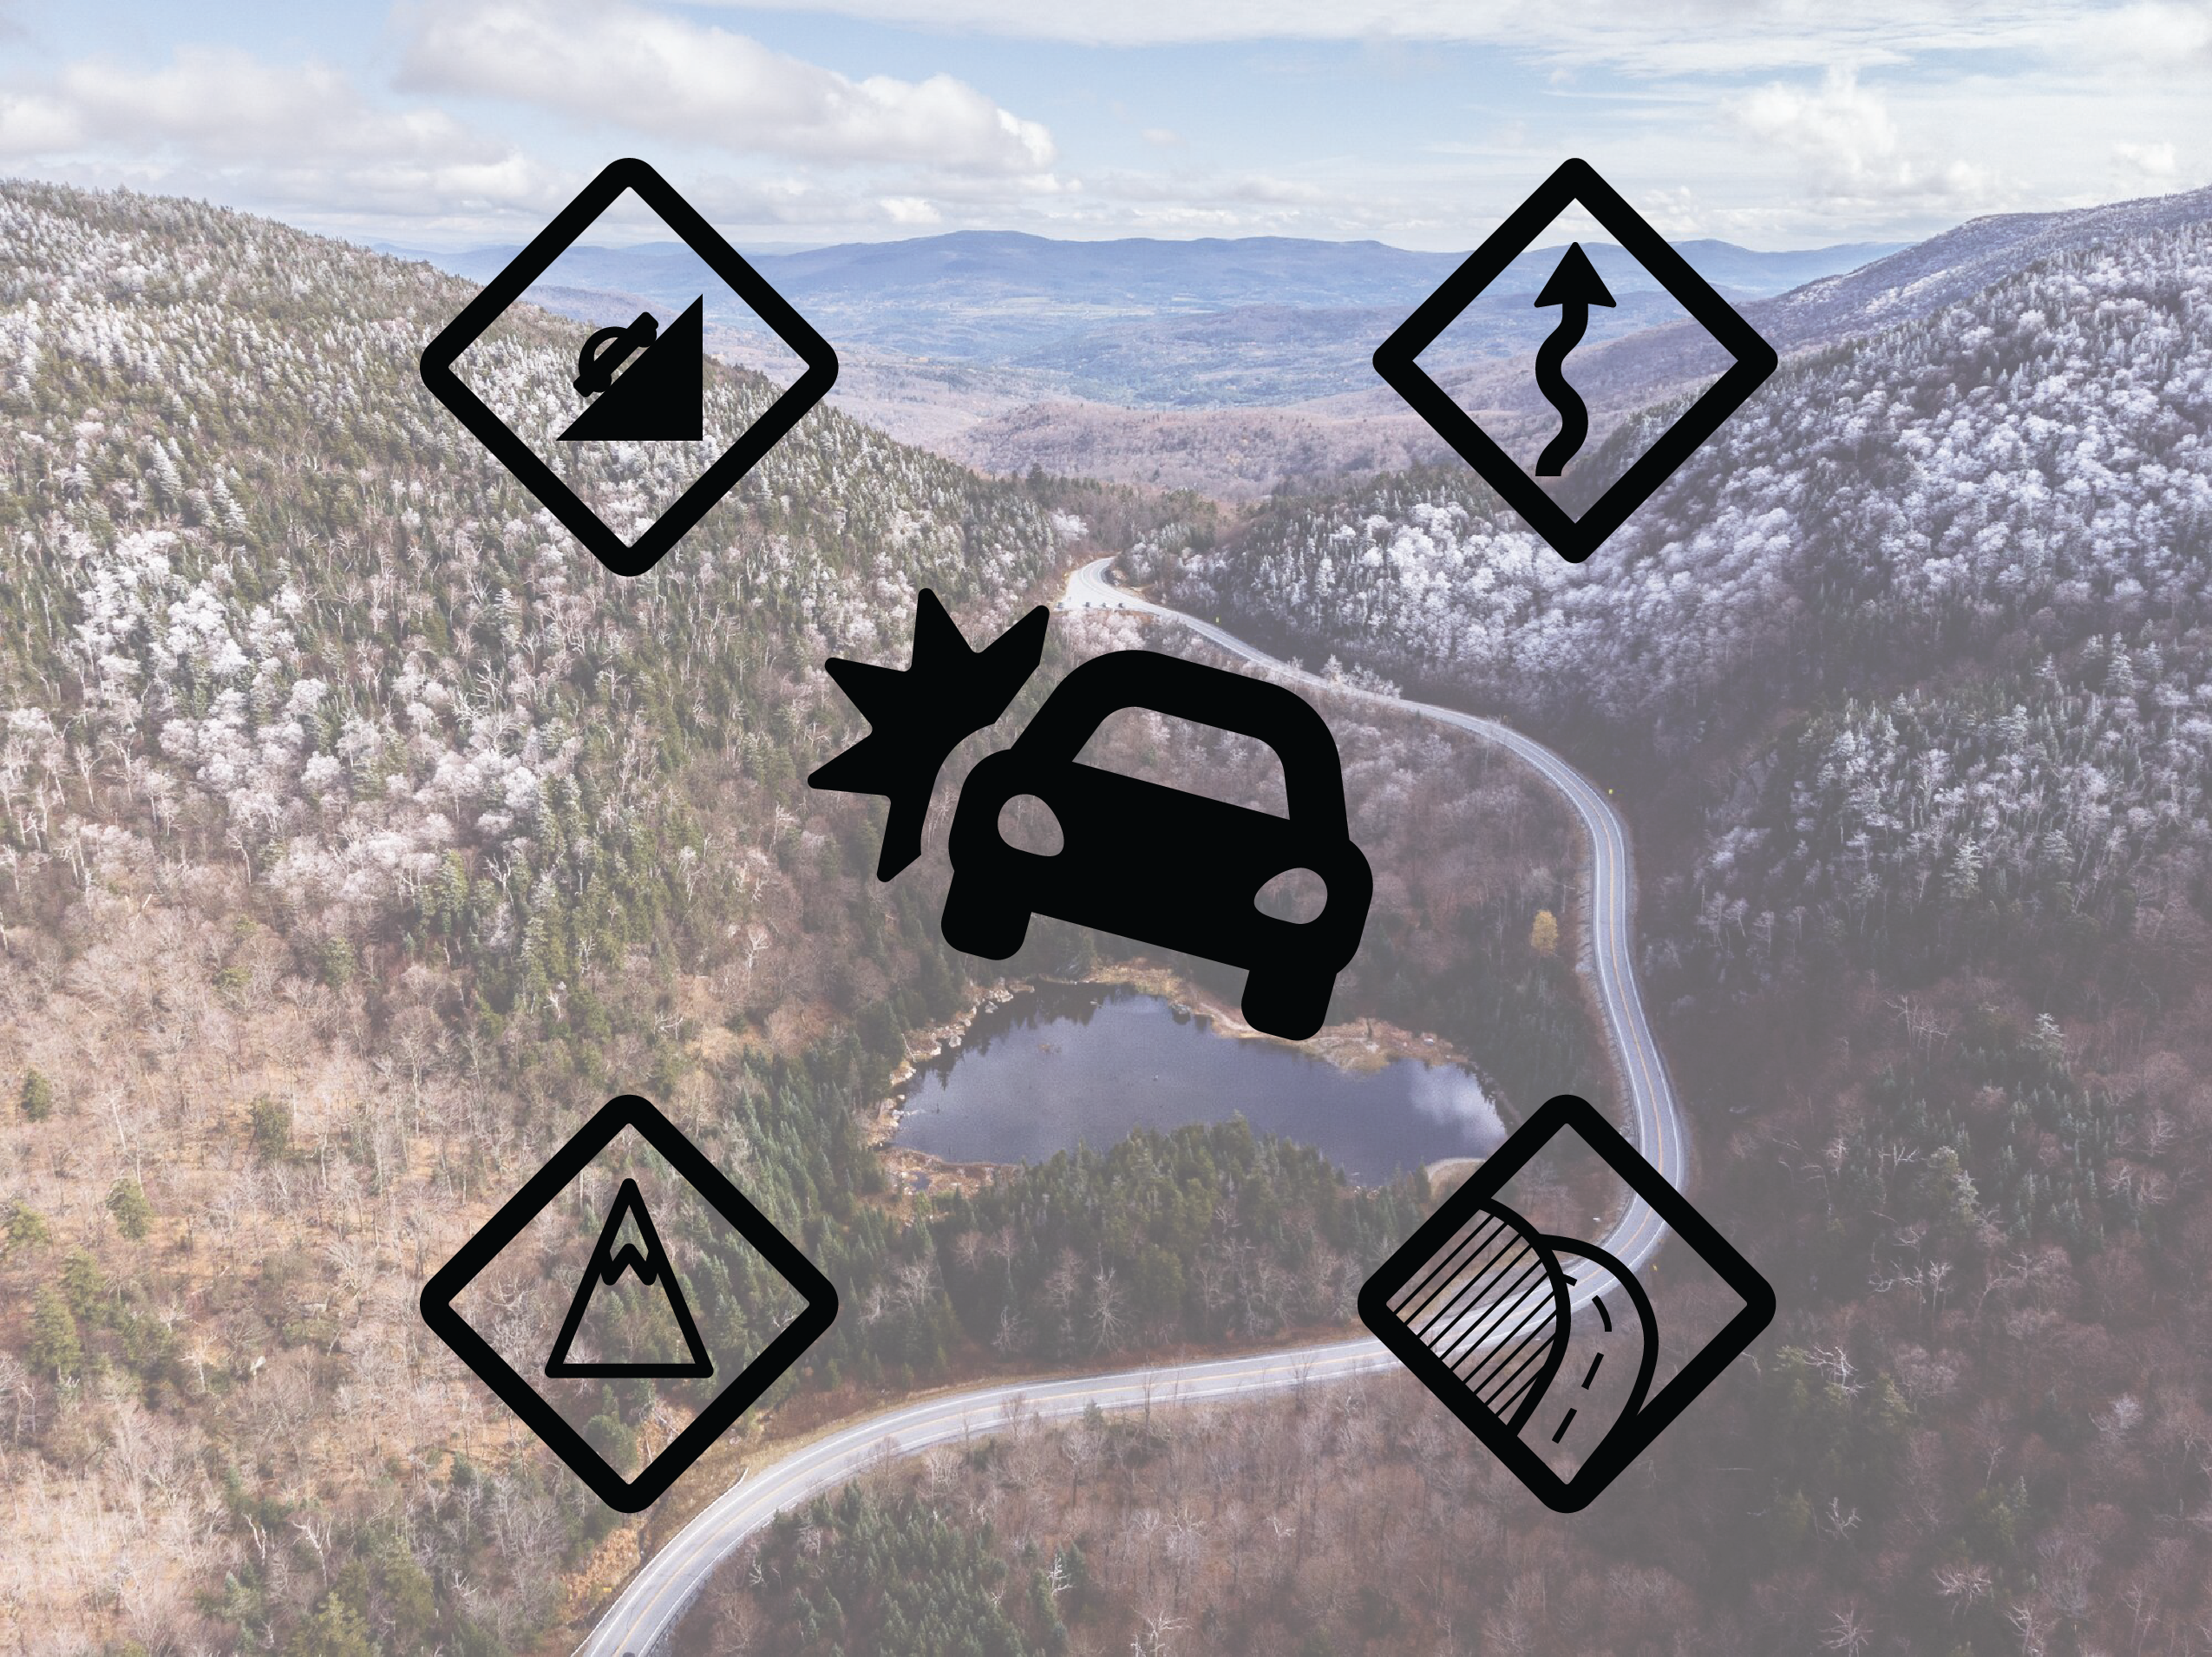
Recalculating Your Route and Your Risk?
This is my Senior Thesis in Geography, where I use QGIS Python scripting and automation to identify hazardous mountain roads in the rural Central Green Mountains of Vermont.
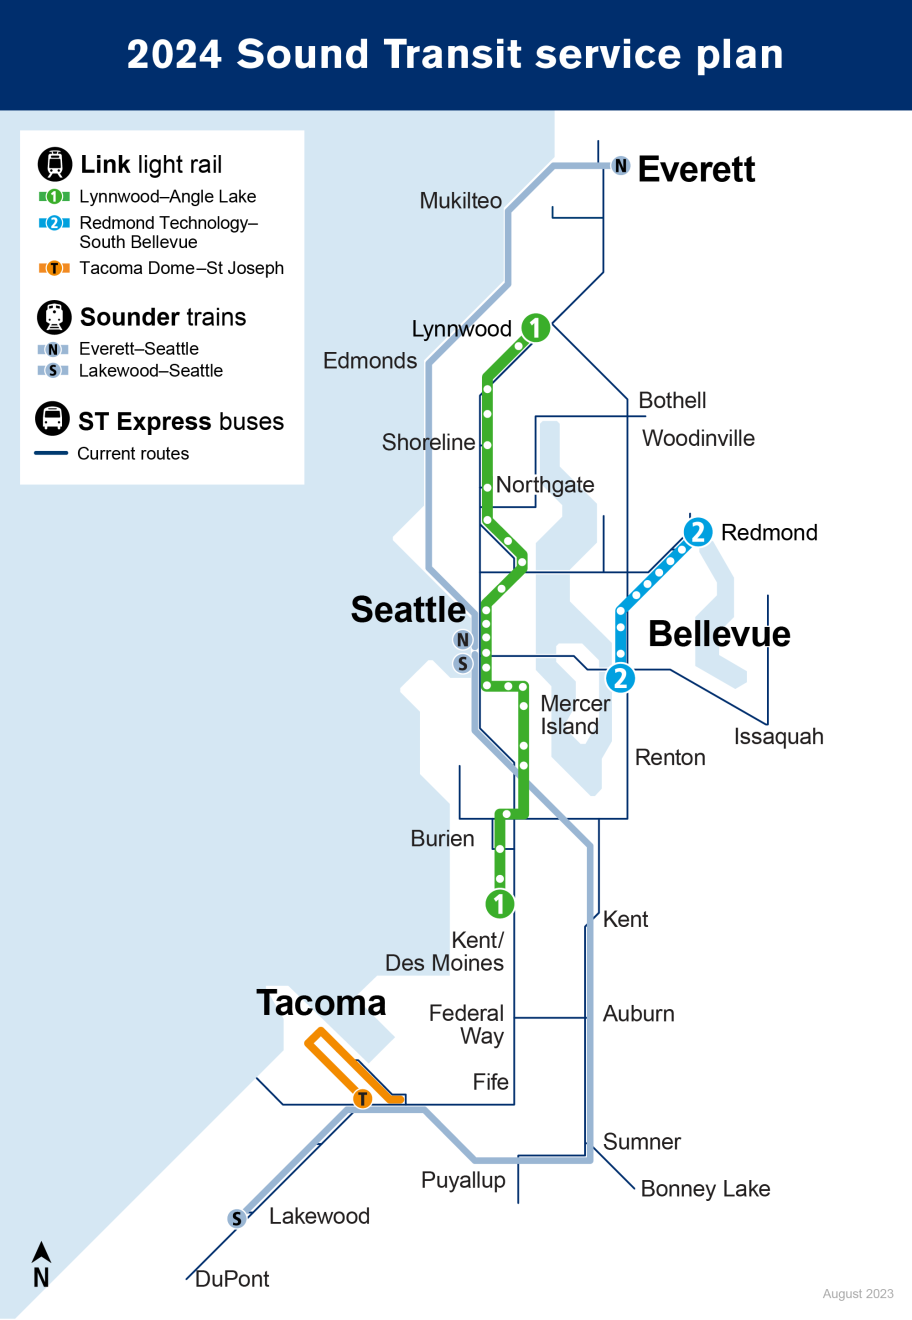
CAD to GIS File Conversion Tool
This is the code for an ArcGIS tool made during my internship with Sound Transit that converts CAD data of a link light rail station's floor to GIS data in a geodatabase file. Made with ArcGIS Pro's ArcPy package for Python.
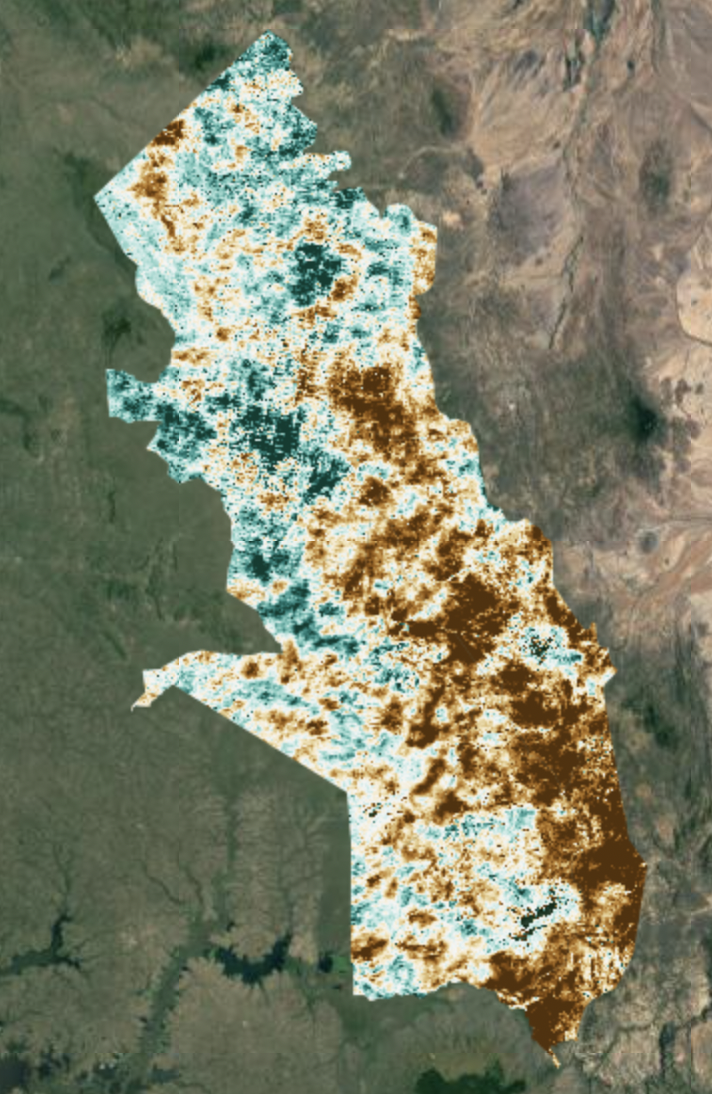
Drought in Uganda
This is an online app made in my Environmental GIS class. The app uses Satellite data using infrared light to visualize a drought in Northeast Uganda this year. Made with GEE.
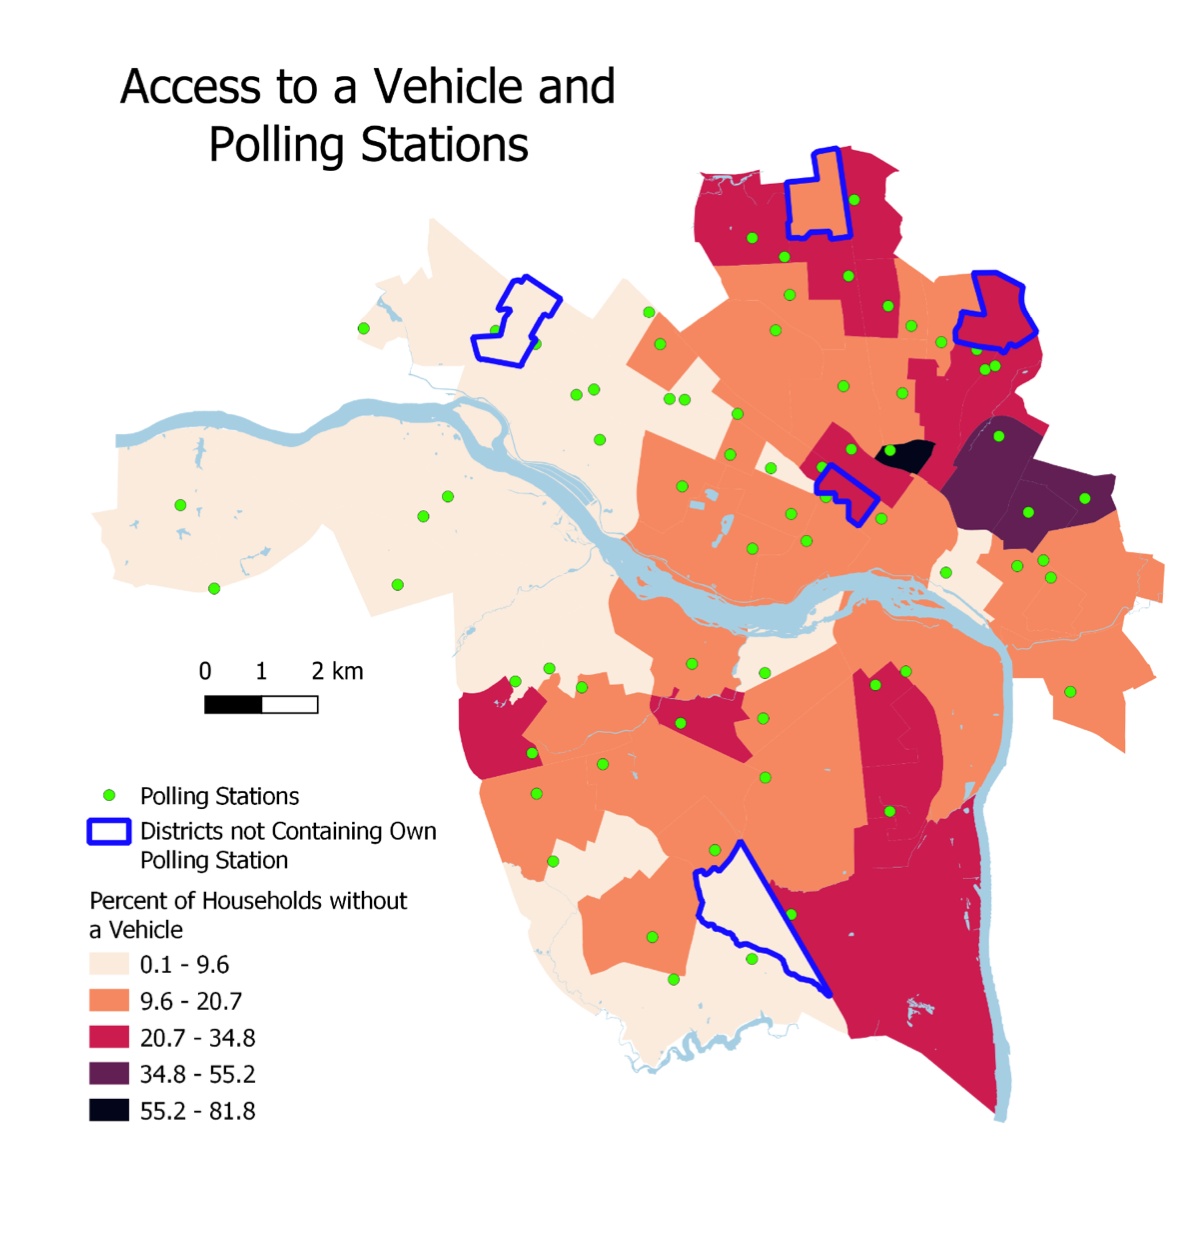
Voting Access Visual Essay
This is a visual essay made in my Human GIS class. The file shows differences in access to polling stations by neighborhood in Richmond, Virginia. Made with QGIS.
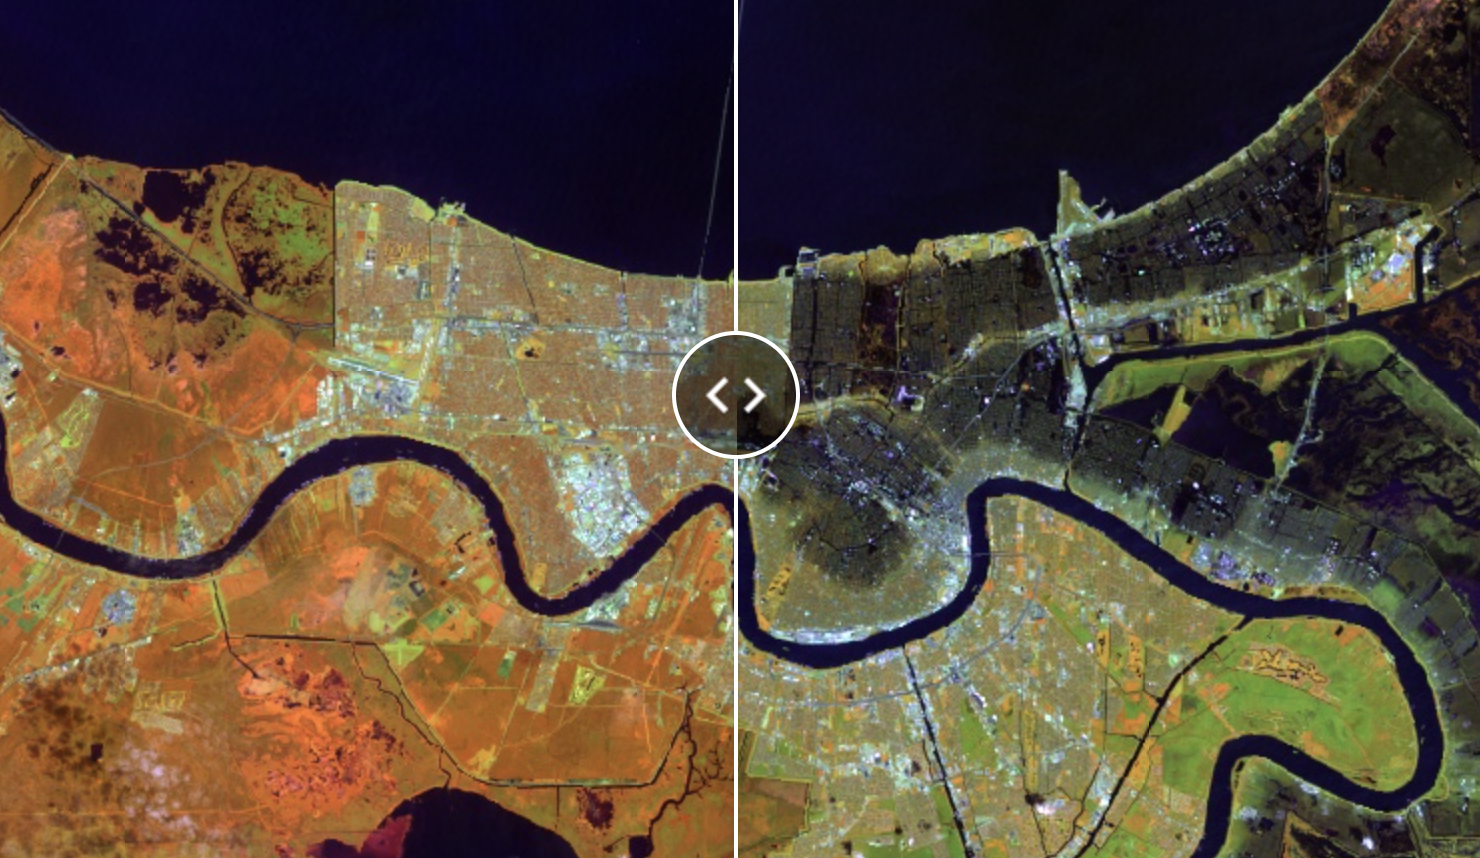
Hurricane Katrina in New Orleans
This is an online app made in my Environmental GIS class. The app uses Satellite data using infrared light to see the damage to local forests around New Orleans After Hurricane Katrina. Made with GEE.
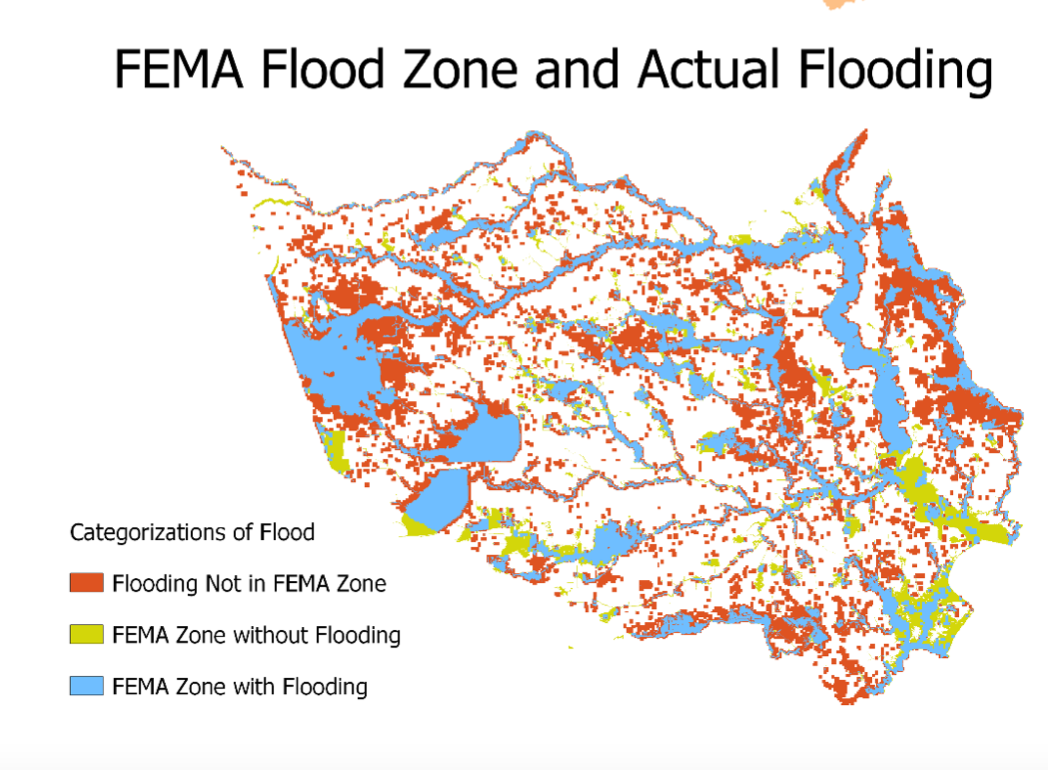
Hurricane Harvey Flooding Visual Essay
This is a visual essay made in my Human GIS class. The file shows which parts of Houston were affected the most by Hurrican Harvey. Made with QGIS.
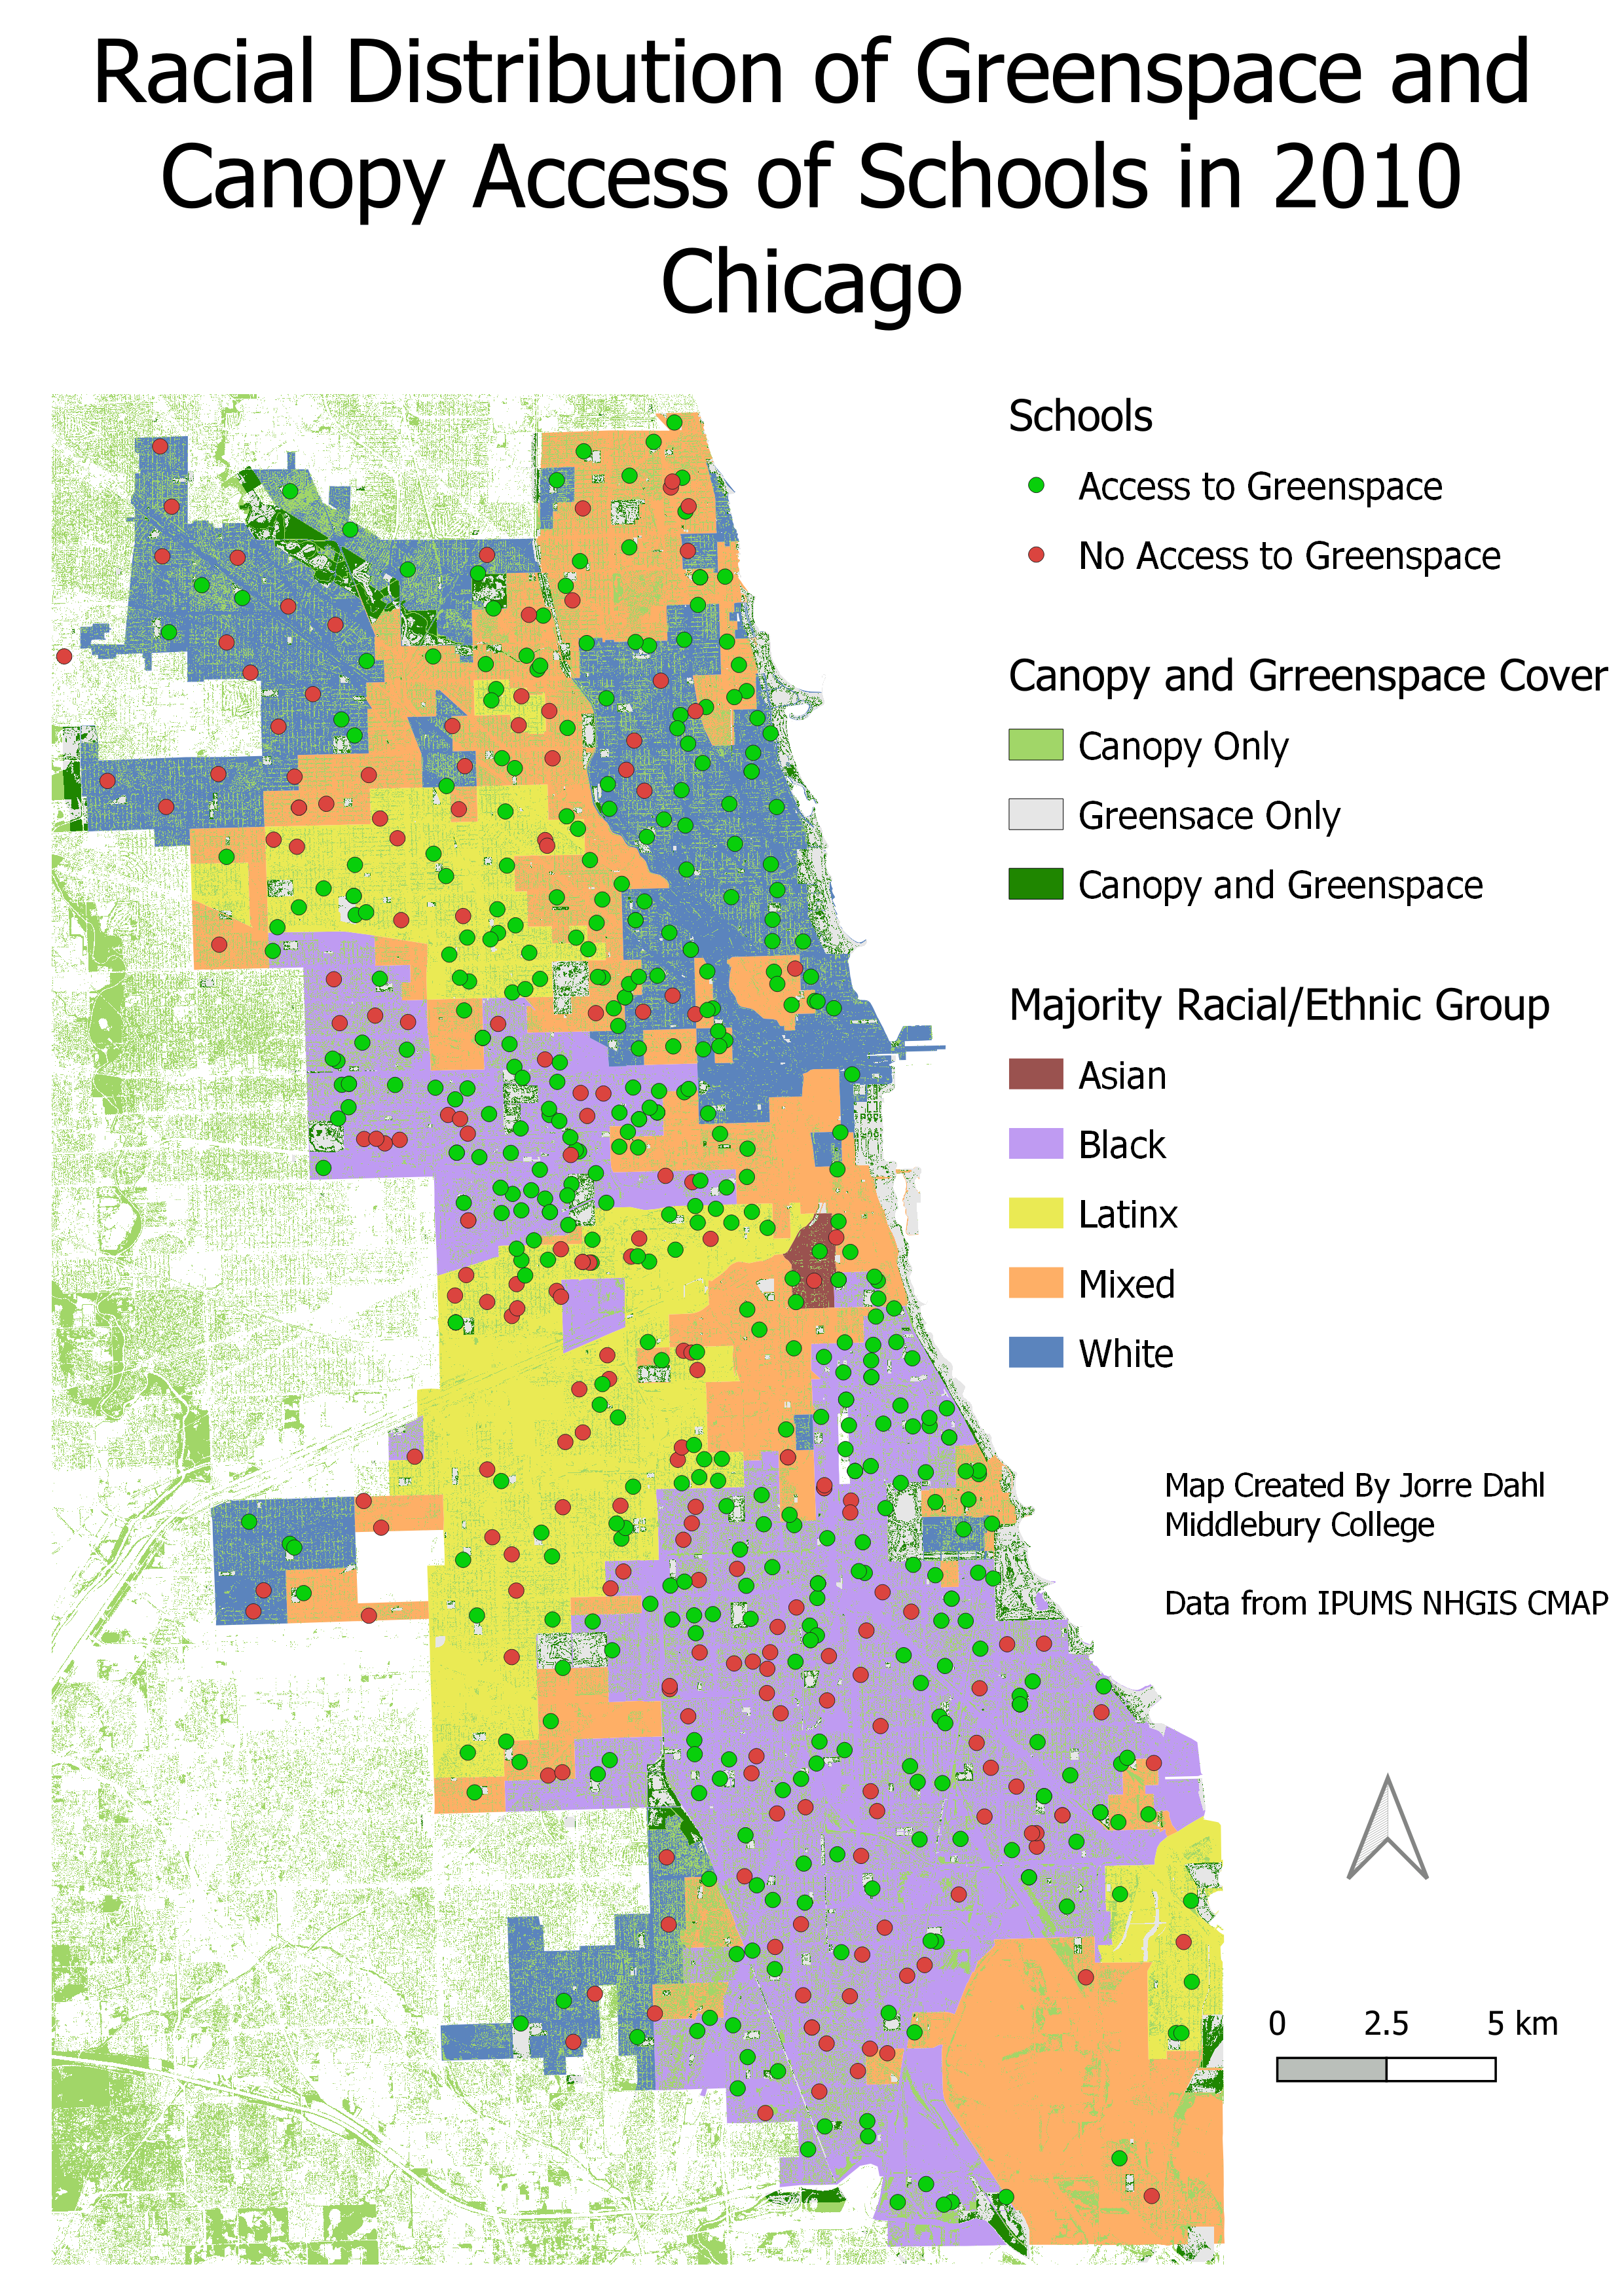
Map of Greenspace in Chicago
This is a map made in my Human GIS class. The map shows access to greenspace and canopy in Chicago neighborhoods and schools by majority racial group. Made with QGIS.
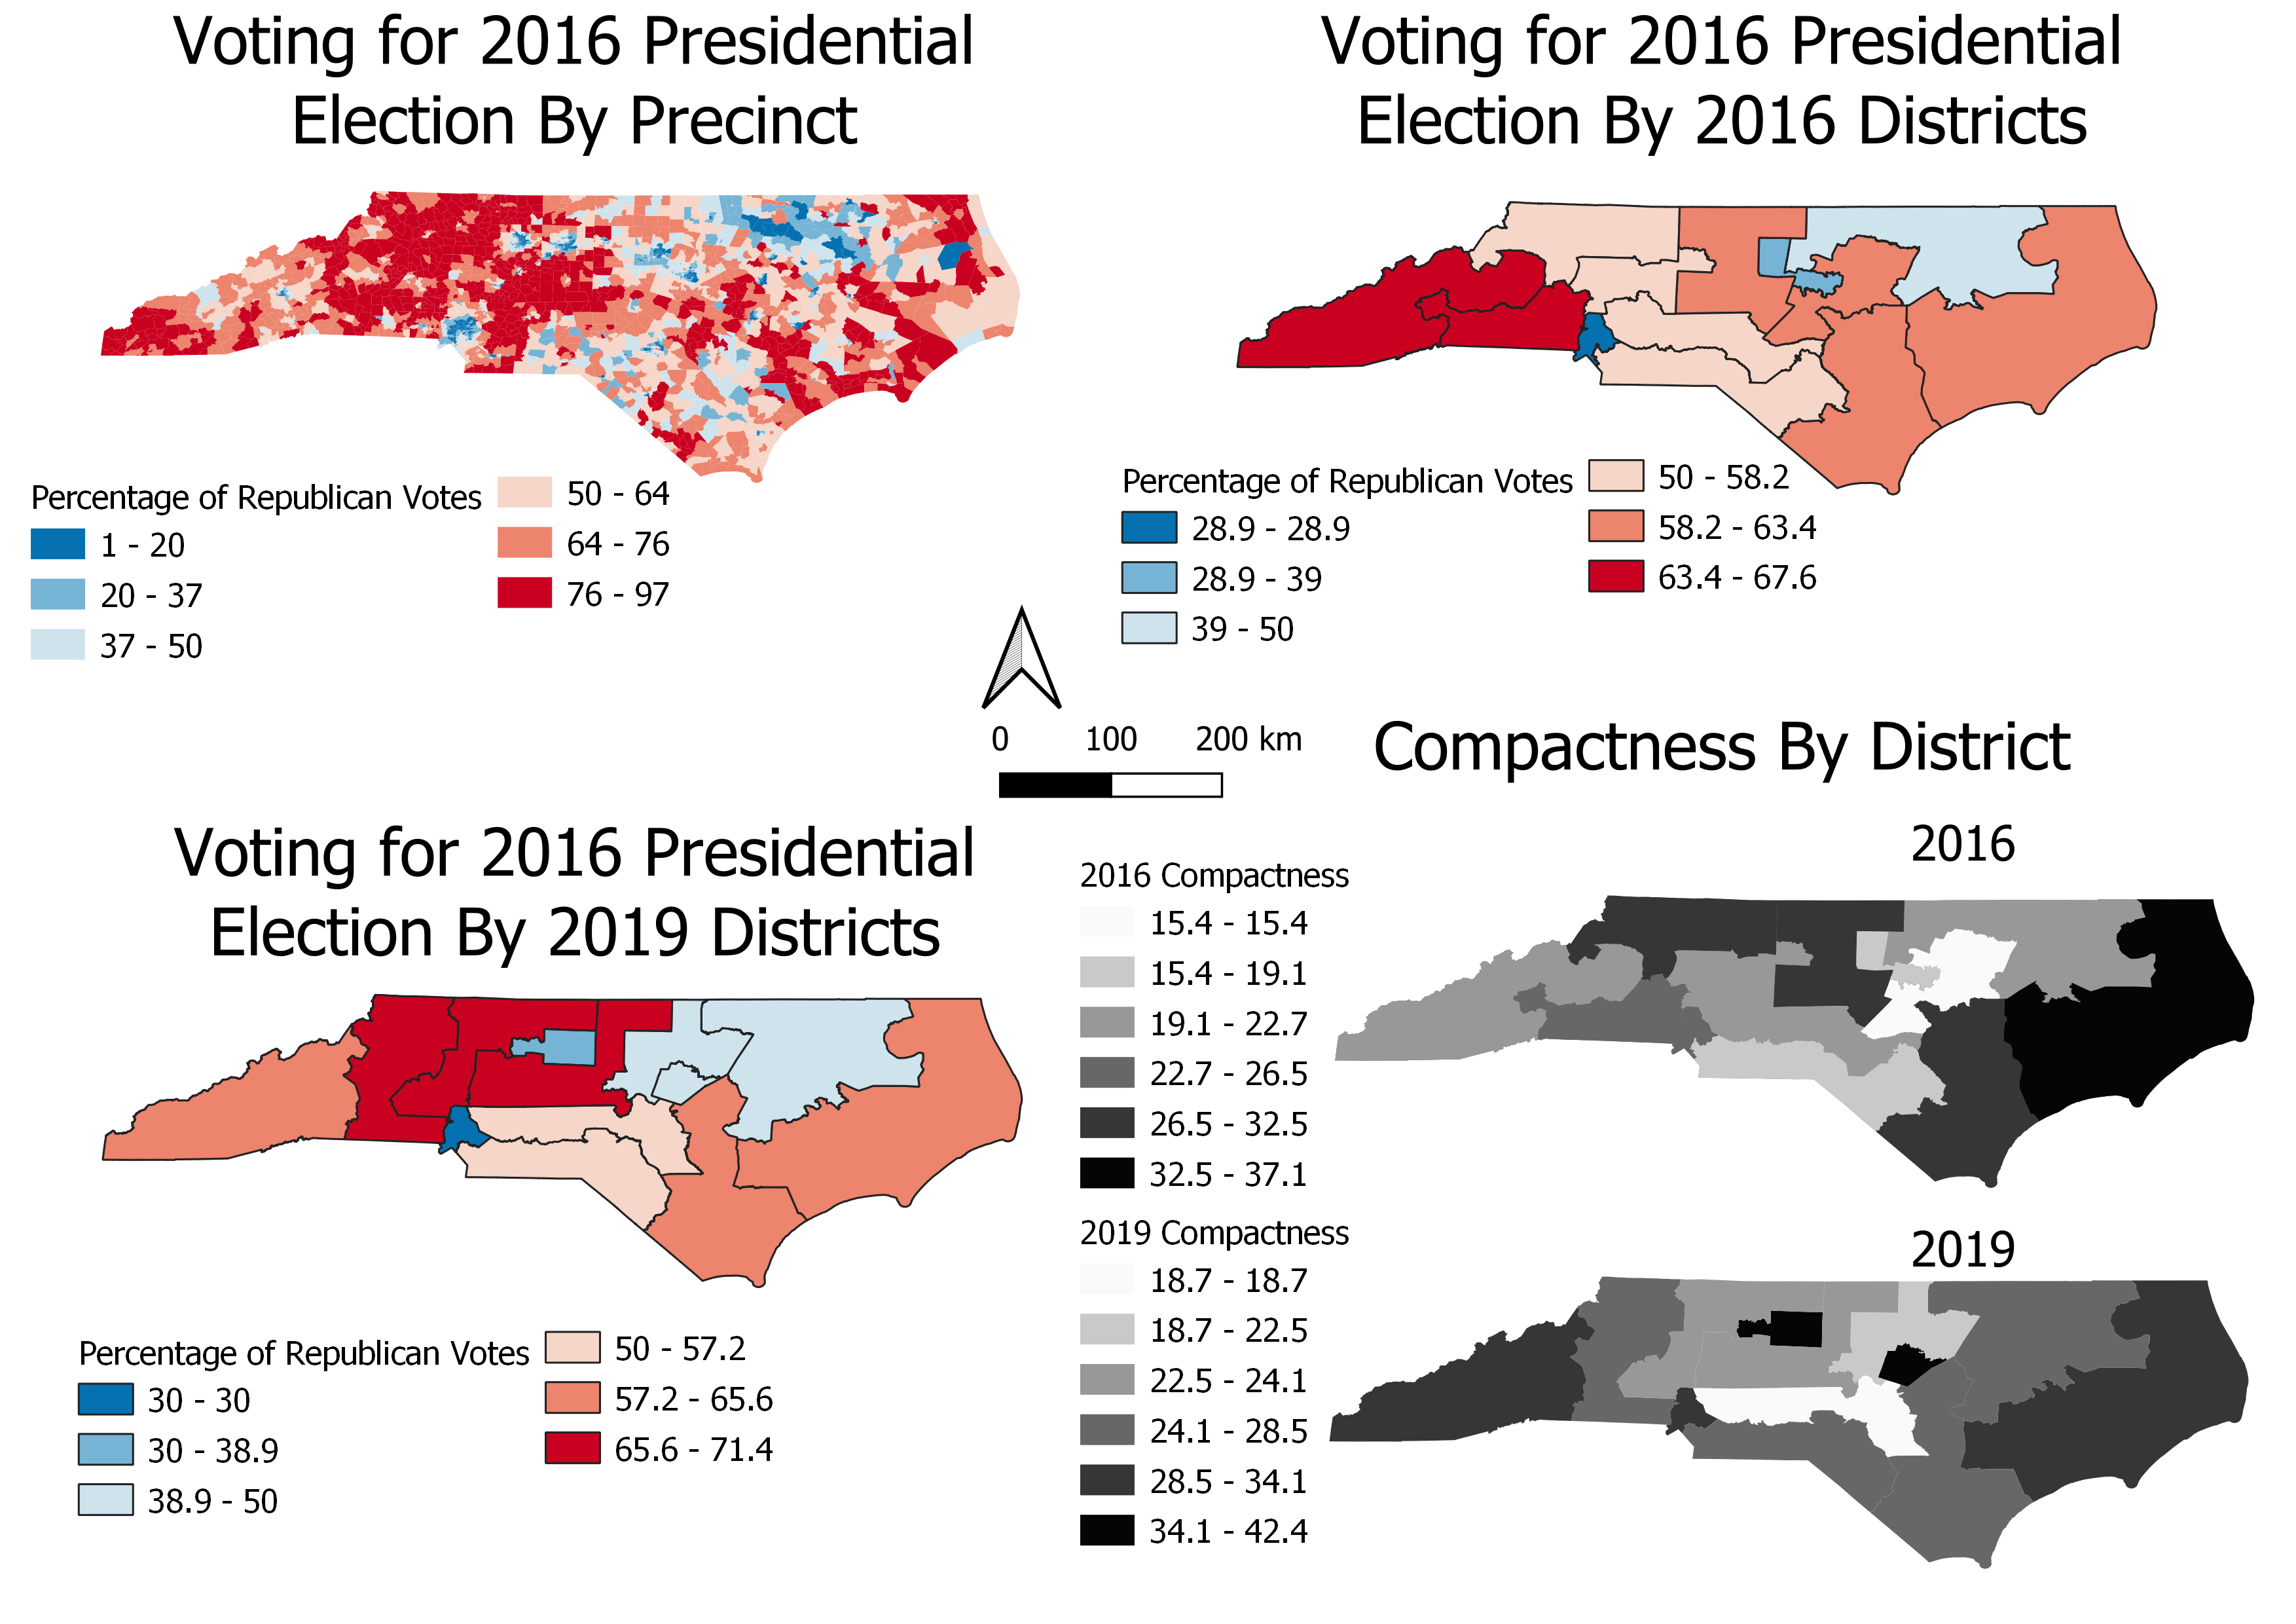
North Carolina Voting Districts
This is a map made in my Human GIS class. The map shows the effects of gerrymandering and differenct district plans in North Carolina. Made with QGIS.
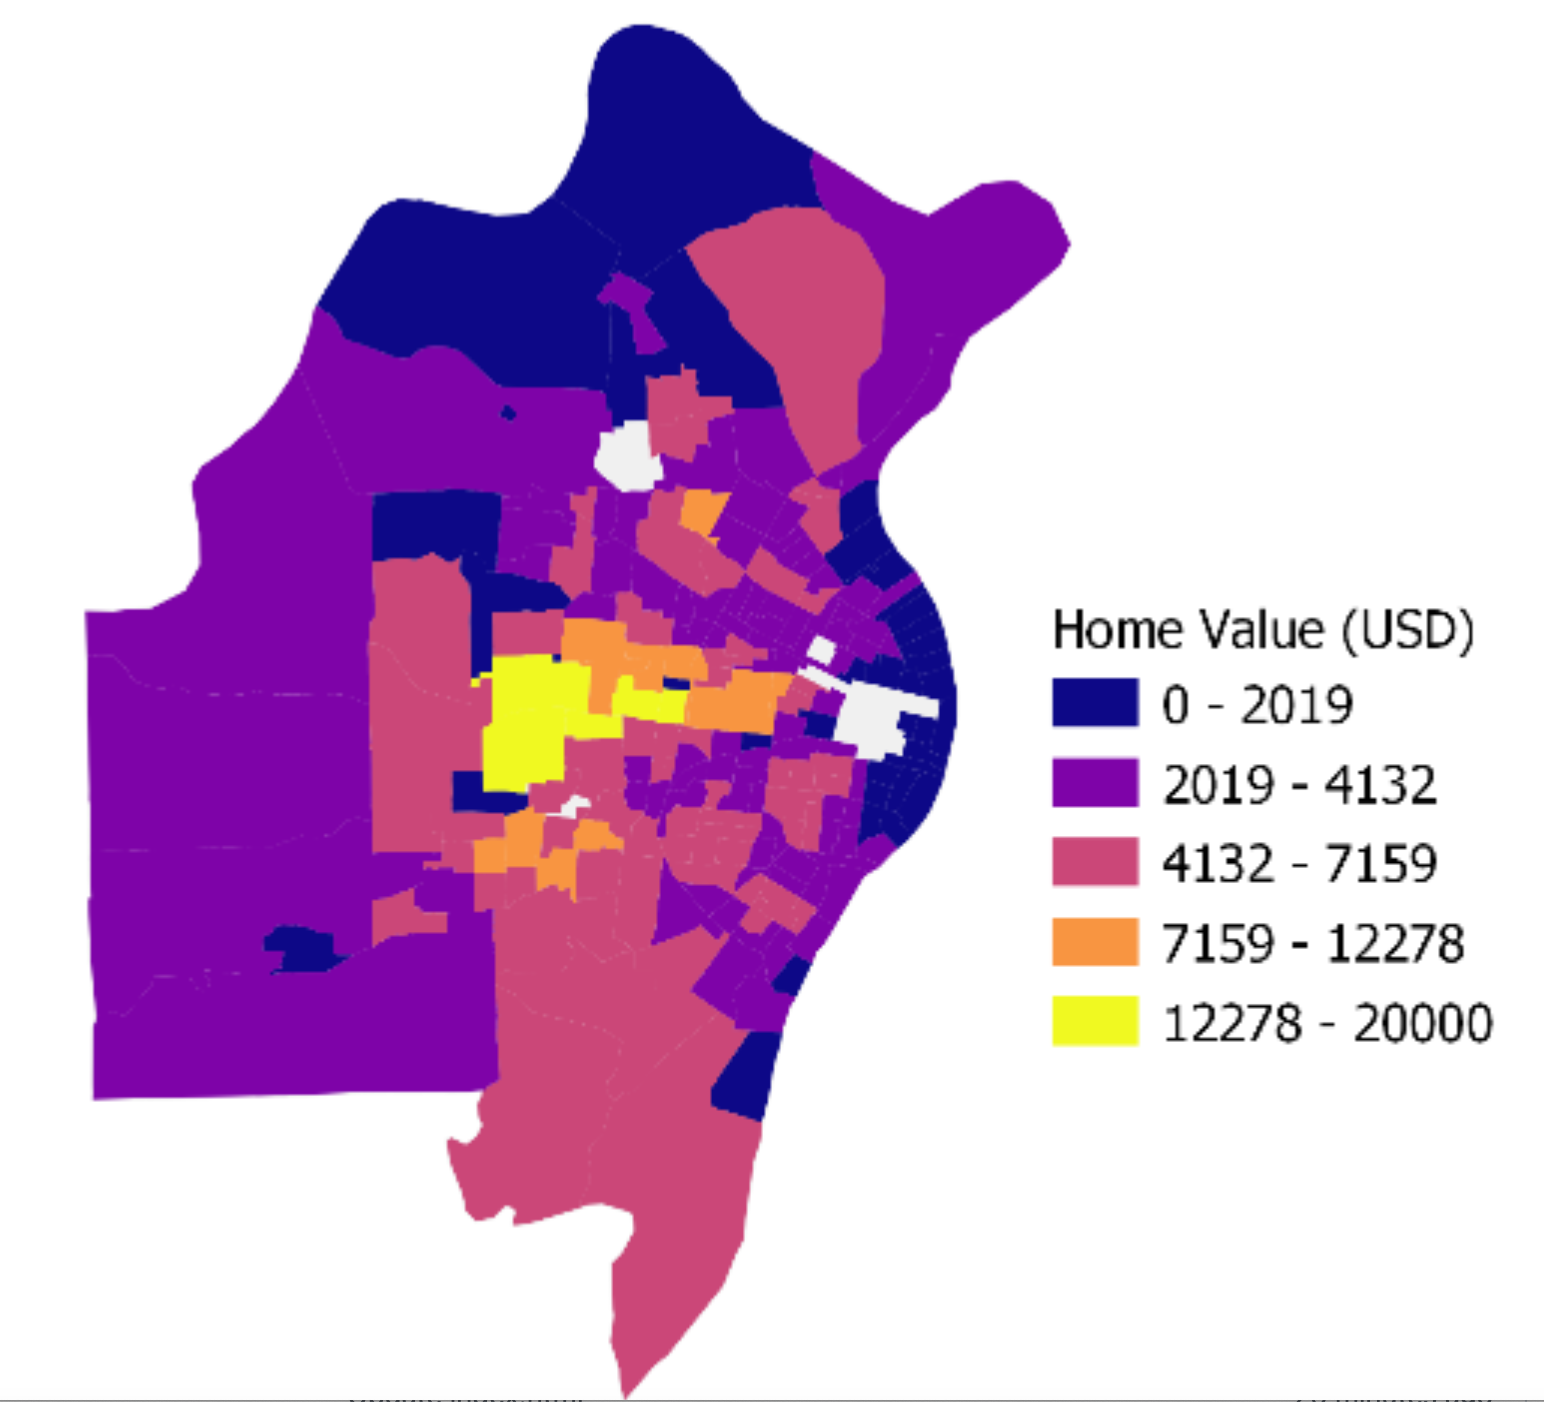
Median Home Value Visual Essay
This is a visual essay made in my Human GIS class. The file shows racial disparities of median home value in St. Louis. Made with QGIS.